|
ภาพเส้นทางพายุ
Storm tracking
|
ภาพเส้นทางพายุบริเวณประเทศไทยในอดีตตั้งแต่ปี พ.ศ. 2494 – ปัจจุบัน แสดงเส้นทางพายุ ตามช่วงวันและเวลาการเกิดพายุ รวมถึงความเร็วหรือความแรงของพายุแต่ละลูก ความถี่ เมื่อเกิดพายุ
Diagrams of storm tracks over Thailand in the past since 1951 to current. Storm path is displayed with date and time, along with storm speed, strength, and frequency of storm occurrence.
|
|
ภาพถ่ายดาวเทียม MTSAT-2
Images from satellite MTSAT-2

|
ภาพถ่ายดาวเทียม MTSAT-2 แสดงกลุ่มเมฆบริเวณประเทศไทย ยิ่งมีกลุ่มเมฆกระจุกตัวกันอย่างหนาแน่นมากบริเวณใด โอกาสที่จะเกิดกลุ่มฝนในบริเวณนั้นก็จะยิ่งสูงตามไปด้วย ความถี่ ทุก 1 ชั่วโมง
MTSAT-2 satellite images show cloud cover over Thailand. The denser the cloud cluster, the higher chance of rain it will be. Frequency of images is hourly.
|
|
ภาพแผนที่อากาศ (Weather maps)

|
ภาพแผนที่อากาศ แสดงถึงลักษณะอากาศที่เกิดขึ้นในขณะใดขณะหนึ่ง โดยประกอบไปด้วยข้อมูลความกดอากาศ แนวปะทะ และร่องความกดอากาศ โดยอักษร H แทนศูนย์กลางของบริเวณที่มีความกดอากาศสูง หรือมวลอากาศเย็น อักษร L แทนศูนย์กลางของบริเวณที่มีความกดอากาศต่ำ หรือมวลอากาศร้อน และเส้นโค้งที่เชื่อมต่อระหว่างบริเวณที่มีความกดอากาศเท่ากัน เรียกว่า เส้นไอโซบาร์ (Isobar) ตัวเลขบนเส้นไอโซบาร์แสดงค่าความกดอากาศที่อ่านได้ซึ่งอยู่ในหน่วยมิลลิบาร์ ถ้ามีกำลังแรงมากและปรากฏอยู่บนอักษร H บริเวณนั้นก็จะมีอากาศหนาวเย็นมาก แต่ถ้าปรากฏอยู่บนอักษร L บริเวณนั้นก็จะมีฝนตกหนักหรือพายุฝนฟ้าคะนองเกิดขึ้นได้ ความถี่ ทุก 6 ชั่วโมง
Weather maps illustrate weather characteristics at a single point in time. Often, a weather map displays air pressure level, fronts, and troughs. The letter H represents the center of the high pressure area or cold air mass while the letter L is associated with low pressure area or hot air mass. The curve line connecting the area with the same pressure is called isobar. Numbers on the bar shows the pressure reading and are in unit of mbar. If the letter H appears on any area, the weather will be very cold, but if the letter L is present, then that area will have heavy rain and thunderstorm. Map frequency is every 6 hours.
|
|
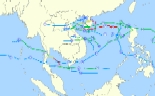
ภาพเส้นทางพายุ (Storm Tracking)

|
แผนที่วิเคราะห์เส้นทางและความแรงของพายุ โดยจะแสดงสภาพพายุ ณ ปัจจุบันและมีการทำนายถึงเส้นทางพายุ และความแรงของพายุในอนาคตอันใกล้ด้วย ความถี่ เมื่อเกิดพายุ
Maps for tracking path and strength of storms. The current state of the storm and nowcasting of storm path and strength is reported.
|
|
ภาพอุณหภูมิพื้นผิวน้ำทะเล (Sea Surface Temperature: SST)

|
แสดงถึงอุณหภูมิผิวน้ำทะเลบริเวณต่างๆ โดยทั่วไปแล้วค่าอุณหภูมิจะก่อตัวจากน้อยไปมากจนกระทั่งเกิดพายุ โดยอุณหภูมิบริเวณใดที่สูงเกินกว่า 26.5 องศาเซลเซียสและแตกต่างจากบริเวณข้างเคียงมากขึ้นเท่าไร มักเป็นสัญญาณเตือนถึงการการเกิดพายุในเขตร้อนมากขึ้นเท่านั้น ความถี่ ทุก 12 ชั่วโมง
The images represent sea surface temperature. Typically, the area with higher temperature has a higher tendency for storm formation. Any area with surface temperature higher than 26.5 degrees Celsius and has a vast temperature gradient from its surroundings should be monitored as tropical storm formation is very likely. Image frequency is every 12 hours.
|
|
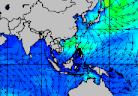
ภาพความสูงและทิศทางของคลื่นทะเล (Wave Height with Wave Direction, Sea Surface Height: SSH)
|
แสดงถึงความสูงและทิศทางของคลื่นในทะเลบริเวณต่างๆ บริเวณใดมีมีกลุ่มคลื่นสูงต่างจากบริเวณใกล้เคียง บริเวณนั้นมักจะมีฝนฟ้าคะนองหรือพายุเกิดขึ้น ความถี่ ทุก 12 ชั่วโมง
The images represent wave height and wave direction. Any area with wave height much higher than surroundings is usually area with thunderstorm or new storm formation. Image frequency is every 12 hours.
|
|
ภาพค่าเบี่ยงเบนความสูงระดับน้ำทะเลที่ผิดไปจากเกณฑ์ปกติจากดาวเทียม Jason-1 GFO และ ENVISAT (Sea Surface Height Anomaly: SSHA)

|
แผนภาพแสดงผลต่างของความสูงของคลื่นปัจจุบันกับความสูงของคลื่นจากเกณฑ์ปกติ สำหรับเพื่อติดตามความแปรปรวนของคลื่นในมหาสมุทรที่ผิดไปจากปกติ บริเวณใดมีค่ามากๆ หรือมีสีแดงเข้มบริเวณนั้นจะมีฝนมาก ในทางกลับกันบริเวณใดมีค่าน้อยๆ หรือมีสีน้ำเงินเข้ม บริเวณนั้นจะมีฝนน้อย และสามารถใช้ประกอบการคาดการณ์ถึงสภาพฝนในประเทศไทยได้ โดยถ้าบริเวณประเทศไทยมีกลุ่มคลื่นสีแดงล้อมรอบ ส่วนทางฝั่งตะวันออกของมหาสมุทรแปซิฟิกมีกลุ่มคลื่นสีน้ำเงินเป็นทางยาว ก็อาจคาดการณ์ได้ว่าประเทศไทยจะมีฝนมากกว่าปกติ ในทางกลับกันถ้าบริเวณประเทศไทยมีกลุ่มคลื่นสีน้ำเงินล้อมรอบ ส่วนทางฝั่งตะวันออกของมหาสมุทรแปซิฟิกมีกลุ่มคลื่นสีแดงเป็นทางยาว ก็อาจคาดการณ์ได้ว่าประเทศไทยจะมีฝนน้อยกว่าปกติ ความถี่ ทุก 1 วัน
Image showing the deviation (anomaly) of the current sea level or sea surface height from the average sea level. This parameter is used to monitor the turbulence and energy of the ocean. A dark red zone is an area with hotter water and generally wetter weather. In turn, the dark blue area usually associates with colder water and drier weather or less rain. The data is useful for medium range rainfall forecast. If the image has a red color in the coastal areas around Thailand while the eastern Pacific Ocean has a blue color, it is projected that Thailand will be wetter than normal. On the opposite, if the image has a blue color in the coastal areas around Thailand while the eastern Pacific Ocean is warmer (red), then Thailand may be drier than normal. Image frequency is daily.
|
|
แผนภาพการเปลี่ยนแปลงรายเดือน และรายสองสัปดาห์ของอุณหภูมิผิวน้ำทะเล
Images of change in monthly and semimonthly sea surface temperature

|
แผนภาพผลต่างของอุณหภูมิผิวน้ำทะเลในสองช่วงเวลามาเปรียบเทียบกัน เพื่อติดตามแนวโน้มของอุณหภูมิผิวน้ำทะเลว่าร้อนขึ้นหรือเย็นลงในบริเวณใด โดยมีการเปรียบเทียบ 2 รูปแบบคือ รายเดือน อุณหภูมิผิวน้ำทะเลเดือนปัจุบันเปรียบเทียบกับเดือนก่อนหน้า เพื่อติดตามการเปลี่ยนแปลงฤดูกาล โดยดูได้จากบริเวณผิวน้ำทะเลที่อุณหภูมิสูงและต่ำเริ่มมีการย้ายตำแหน่งแทนที่ซึ่งกันและกัน รายสองสัปดาห์ อุณหภูมิผิวน้ำทะเลในช่วง 2 สัปดาห์ล่าสุดเปรียบเทียบกับ 2 สัปดาห์ก่อนหน้า เพื่อเป็นแนวทางในการพิจารณาแนวโน้มการเกิดพายุในอนาคตได้ โดยบริเวณใดมีอุณหภูมิต่ำหรือสีน้ำเงินเป็นกลุ่มเล็กๆ และอยู่ท่ามกลางบริเวณที่มีอุณหภูมิสูงหรือสีแดงล้อมรอบ บริเวณนั้นมักจะเป็นบริเวณที่เกิดพายุ และร่องที่เป็นแนวปะทะระหว่างสีแดงและสีน้ำเงิน มักจะเป็นบริเวณที่เกิดร่องฝน หรือร่องเส้นทางพายุ
The images show the differences in sea surface temperature between 2 periods. They are used to monitor a trend whether the sea is warmer or colder. 1) A change in monthly average sea surface temperature between the current and previous months, to detect season change. In the image, season change is characterized by the location that high temperature and low temperature areas move to replace each other. 2) A change in semimonthly average sea surface temperature between the latest 2 weeks and the previous 2weeks, to analyze the possibility of storm formation. The location where a cold (blue) area is surrounded by warm (red) areas has a potential for storm formation. Another pattern is a front between cold and warm areas which may become rain trough or storm path.
|
|
แผนภาพการเปลี่ยนแปลงรายสัปดาห์ของค่าเบี่ยงเบนความสูงระดับน้ำทะเล
Images of weekly change in sea surface height anomaly

|
แผนภาพแสดงผลต่างของค่าเฉลี่ยรายสัปดาห์ของความสูงน้ำทะเลที่เบี่ยงเบนไปจากปกติ (SSHA) ซึ่งแสดงถึงการเคลื่อนตัวของกระแสน้ำและพายุ ใช้เพื่อติดตามและคาดการณ์การเกิดพายุได้ โดยบริเวณใดมีกลุ่มคลื่นยกตัวสูงขึ้นจากช่วงก่อนหน้ามาก บริเวณนั้นมักจะก่อตัวเป็นพายุได้
The images show the deviation of the latest weekly-average sea surface height anomaly from the previous week’s weekly average value. It represents the motion of the currents and storms, and is used to track and predict storm formation. The area with an uplift of sea level compared to previous period generally has a higher tendency to become a storm.
|
|
แผนภาพการศึกษาการเกิดพายุด้วยข้อมูลการเปลี่ยนแปลงรายสัปดาห์ของค่าเบี่ยงเบนความสูงระดับน้ำทะเล
Images in the study of storm formation using the weekly change in sea surface height anomaly

|
แผนภาพแสดงผลต่างของค่าเฉลี่ยรายสัปดาห์ของความสูงน้ำทะเลที่เบี่ยงเบนไปจากปกติ (SSHA) ในแต่ละเหตุการณ์พายุในอดีต ใช้พิจารณาการเปลี่ยนแปลงที่เกิดขึ้นกับค่าเบี่ยงเบนความสูงระดับน้ำทะเลเมื่อเกิดเหตุการณ์พายุและหลังการเกิดพายุ เพื่อใช้วิเคราะห์ย้อนหลังและเป็นแนวทางในการทำนายพายุในอนาคตได้
The images show the deviation of the latest weekly-average sea surface height anomaly from the previous week’s weekly average value. It represents the motion of the currents and storms, and is used to track and predict storm formation. The area with an uplift of sea level compared to previous period generally has a higher tendency to become a storm.
|
|
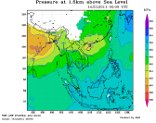
แผนที่อากาศที่ระดับความสูง 1.5 กิโลเมตร
|
ภาพแผนที่อากาศที่ระดับความสูง 1.5 กิโลเมตร แสดงถึงลักษณะอากาศที่เกิดขึ้นในขณะใดขณะหนึ่ง ณ ความสูง 1.5 กิโลเมตรเหนือระดับน้ำทะเลปานกลาง ซึ่งเป็นระดับความสูงของชั้นเมฆฝน
ซึ่งค่าที่อ่านได้นี้จะบอกให้ทราบถึงการเคลื่อนตัวของมวลอากาศในชั้นเมฆฝน ช่วยให้สามารถติดตามการก่อตัวของพายุหมุนได้
Weather maps at 1.5-km altitude show weather characteristics at a single point in time at the height of 1.5 km above mean sea level. This is the altitude for cloud formation. The values of different parameters indicate the movement of air mass relevant to cloud formation and are helpful for monitoring tropical storms.
|
|
แผนที่ลมแนวดิ่ง ที่ระดับความสูง 5 กม.
Maps of vertical wind at 5-km altitude
|
ลมแนวดิ่งคือลมที่พัดจากพื้นขึ้นสู่ท้องฟ้า หากลมแนวดิ่งพัดขึ้นแรงจะแสดงถึงการยกตัวของมวลอากาศที่ดี อากาศมีความชื้นสะสมอยู่มากประกอบกับการยกตัวของอากาศที่ดีจะส่งผลให้ เกิดเมฆและฝนตกได้ ตามลำดับ
ที่ระดับความสูง 5 กิโลเมตรจากระดับน้ำทะเล เป็นระดับความสูงที่มีอุณหภูมิเย็นเหมาะสมแก่การ ควบแน่นของเมฆ
ดังนั้นการยกตัวของมวลอากาศที่มีความชื้น ที่สามารถลอยขึ้นมาถึงระดับนี้ได้ก็จะเกิดเป็นเมฆฝนได้เช่นกัน นอกจากนี้หากบริเวณใดมีลมแนวดิ่งที่ระดับความสูง 5 กิโลเมตร มีความเร็วที่พัดขึ้นสูงจะมีโอกาส เกิดลูกเห็บตกได้
หมายเหตุ ข้อมูลที่แสดงเป็นการคำนวณจากแบบจำลองอุตุนิยมวิทยา มิได้เป็นความเร็วลมที่วัดจริงที่ ระดับความสูงดังกล่าว
Vertical wind is the wind that carries the air mass from the ground up to the sky. A strong vertical wind means a better vertical uplift of air. If the air has high moisture content, the strong vertical wind will help create clouds and rain, respectively. At the altitude of 5 km above the mean sea level, the atmospheric condition favors the condensation of clouds. Therefore, the uplift of moisture air to this altitude will result in clouds. In addition, if the vertical wind velocity is very high, there is a chance of hail occurrence.
Note: The data shown at this high altitude is calculated from a meteorological model, not observed data.
|
|
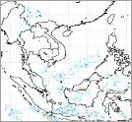
แผนภาพคาดการณ์ความสูงและทิศทางของคลื่นทะเลบริเวณประเทศไทยจากแบบจำลอง WRF-SWAN
Images of Significant Wave Height (Hs) and Direction Forecast Over Thailand from WRF-SWAN model

|
แบบจำลอง SWAN พัฒนาขึ้นเพื่อใช้กับบริเวณน้ำตื้น และเหมาะสมกับลักษณะภูมิประเทศของอ่าวไทยที่มีความลึกเฉลี่ย 45 เมตร โดยระบบพยากรณ์คลื่นที่พัฒนาขึ้นนี้ ได้มีการพัฒนาให้เป็นระบบปฏิบัติการและเชื่อมโยงกับแบบจำลองสภาพภูมิอากาศ WRF เพื่อนำข้อมูลคาดการณ์ลมที่ความ ละเอียดสูงมาใช้เป็นข้อมูลนำเข้าให้กับแบบจำลอง SWAN ให้สามารถพยากรณ์คลื่นล่วงหน้าได้ 7 วัน
The SWAN model is derived based on the wave action balance equation with sources and sinks in shallow waters. Hence the model is suitable to apply on the Gulf of Thailand where the average depth is approximately 45 metres. The atmospheric forcing is derived from the predicted results of WRF model. The WRF wind field data has been used for the initialization of the SWAN model driving for 7 days.
|


 vocab
vocab